When planning and evaluating a cooling tower repair and maintenance program, few cooling tower owners and operators conduct a thorough economic evaluation. And while simple repairs and modifications can be done at minimal expense, more extensive cooling tower maintenance projects require proper planning and economic justification. In fact, a poorly executed economic evaluation can cost millions of dollars in lost productivity.
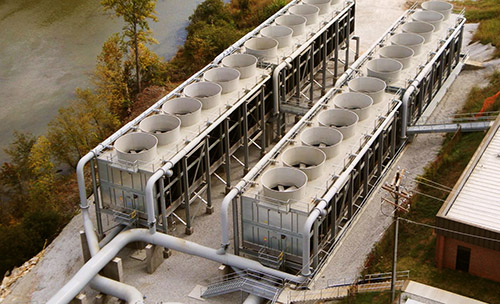
In the past, many chemical process industries (CPI) plants relied on once-through cooling, drawing cooling water from a local source or a man-made pond. The temperature of the incoming water depended on environmental factors and was not controllable, placing the plant operators completely at the mercy of ambient temperature conditions.
Years of experience led many operators to believe that nothing could be done about incoming water temperatures. But today’s cooling technology innovations can often deliver significantly colder water with the same basin footprint and even lower pumping head.
Before upgrading, however, a thorough economic analysis and justification for proposed cooling tower repairs and upgrades should be assessed. There are four steps to a proper economic analysis:
1. Assess the existing tower thermal performance vs. the design thermal performance.
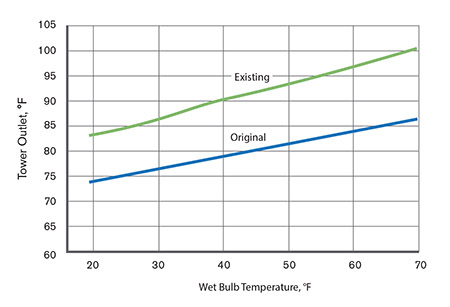
While an inspection and assessment by a local cooling tower specialist is one of the best ways to identify possible causes for the performance deficit, the performance trend of a tower can be assessed with generally available process data. Cooling tower performance is demonstrated by plotting the outlet cold water temperature vs. the inlet wet-bulb temperature at a constant fan speed, water flowrate and heat load. The need for a formal performance test is determined based on several factors. In general, the less temperature and flow data available from installed instrumentation, the more likely a formal performance test will be required, regardless of the tower’s age.
Every cooling tower is designed to deliver a specific outlet temperature (80-95°F) at a design combination of wet-bulb temperature, heat load, water flowrate and air flow. This temperature, however, would be expected only at design conditions, which are normally chosen conservatively, and as such, occur less than 200 h/yr. So when reviewing operating data, one should expect to see temperatures below this design point for all except the hottest days of the year. If not, then the thermal performance of the tower may not be adequate.
Even new towers are unlikely to perform at design levels. According to the Cooling Technology Institute (CTI), about half of newly constructed cooling towers passed their initial performance test in 2014. While CTI is only beginning to publish testing statistics for individual manufacturers under the CTI STD-202 Program, every company knows its own pass/fail ratio and will disclose this information if requested. Since the failure rate of new towers is high, it is advisable to always insist on a tower performance test when purchasing new equipment.
2. Model the response of the process to changes in thermal performance.
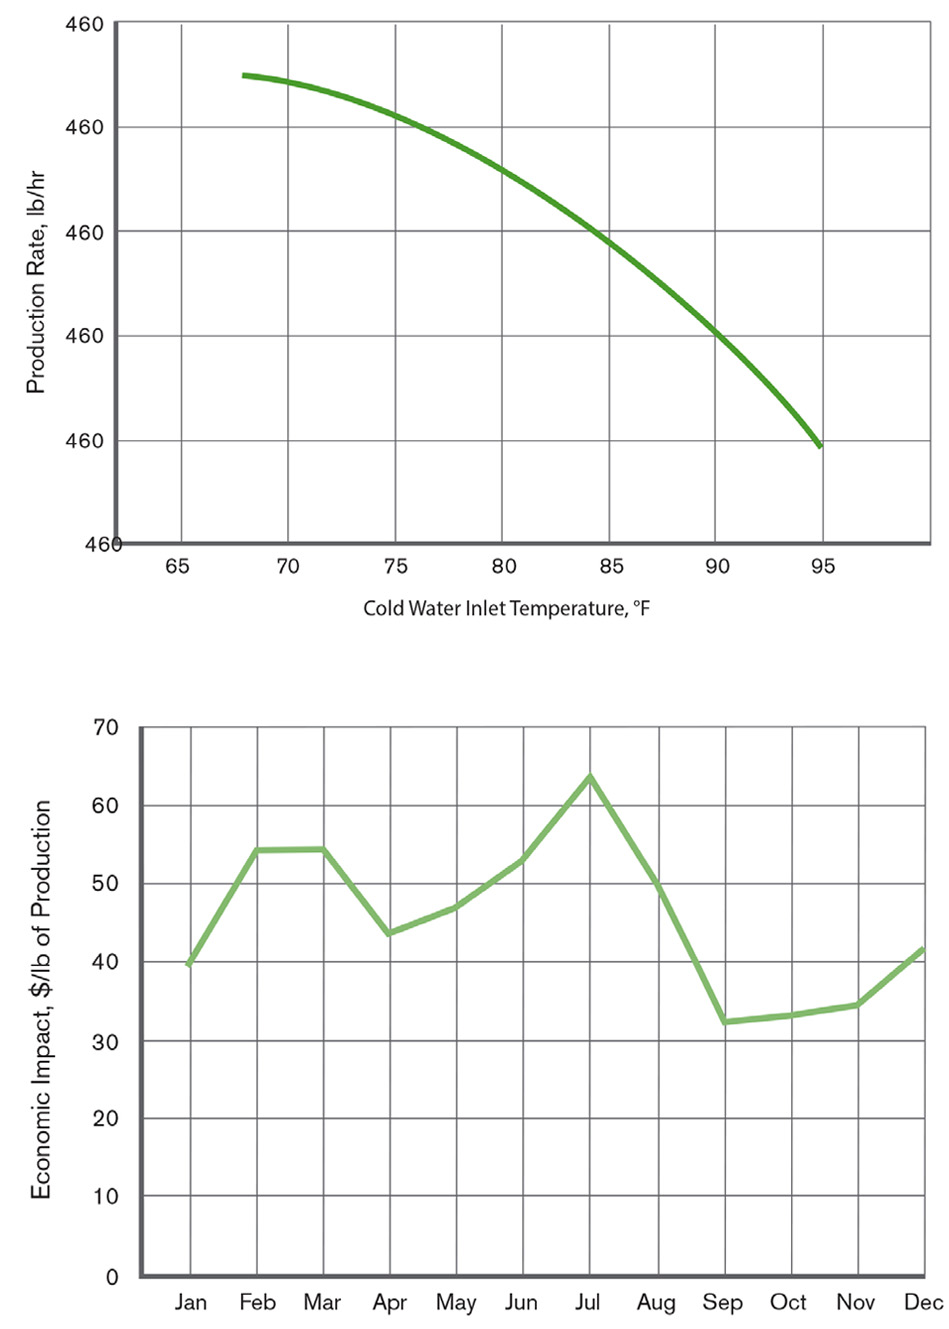
Although performance assessments provide useful technical information, they are devoid of economic analysis. For that analysis, the process that is receiving cold water from the tower must be evaluated and modeled. The second step of the evaluation process is determining whether colder water will have a predictable and measurable economic impact on plant performance.
An order-of-magnitude impact can often be determined by asking “is there a difference in plant capacity or operating cost in the summer vs. in the winter?” If the answer is yes, then some temperature-sensitive processes are probably being impacted by cold water temperature.
Simple regression analysis of operating data can be performed to generate a mathematical function that expresses operating cost or output in terms of cold water temperature. At many plants, this analysis has already been completed. The engineering challenge is to use this knowledge to discover ways to improve plant economics.
This analysis is often complicated, such as when multiple processes rely on a common cooling loop. In such cases, evaluate the most critical or temperature-sensitive process first. The best solution may be to split the cooling loop and provide the coldest water to the part of the plant where it is most valuable.
For each temperature-dependent process, a curve of performance vs. cold water temperature should be generated. Performance can be expressed in terms of product output, power usage or any other key performance indicator relevant to the particular process. Depending on the cost variance, a separate curve is produced for economic impact vs. system performance.
3. Assess multiple repair and upgrade scenarios to develop an optimized solution.
Once the relationship between economic impact vs. system performance is established, the next step is to determine what can be done to improve system performance—and by how much.
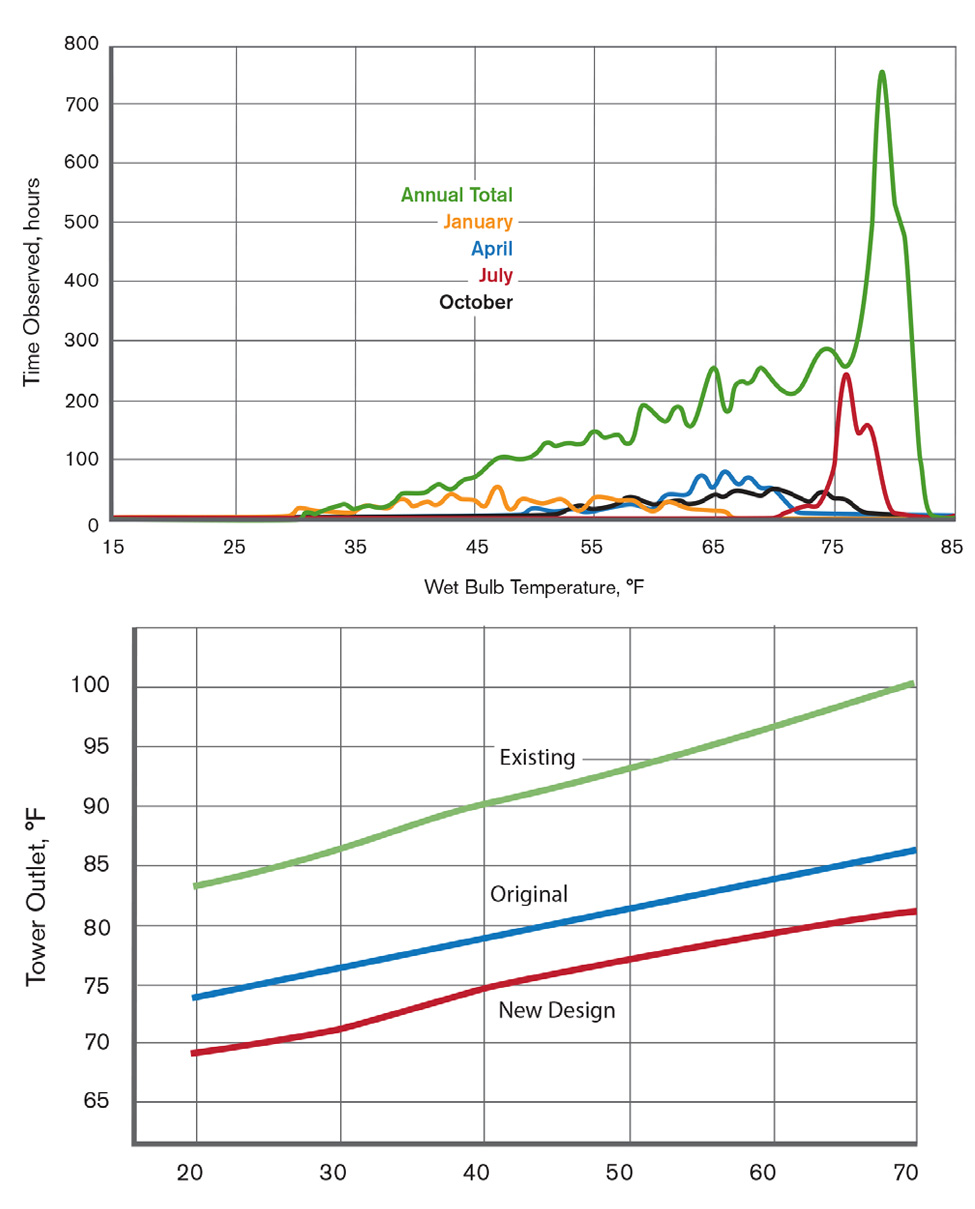
Along with the curves generated in the first two steps (existing thermal performance, process impacts and economic impacts), annual weather variance needs to be added to develop a comparative model that predicts financial impact and payback for various cooling tower upgrade projects. The first comparison is usually between the “as-is” performance curve and the original design performance curve, quantifying the financial impact of the performance degradation.
In some cases, a simple evaluation based on the annual sum of each wet-bulb temperature may be sufficient. Such data is available for hundreds of weather-data collection centers from the National Centers for Environmental Information, National Oceanic and Atmospheric Administration, www.ncdc.noaa.gov.
If the facility makes a product that is sensitive to seasonal price fluctuations, it is more appropriate to run seasonal performance models. In cases where cold water temperature affects the power usage or generation of a plant, it may be appropriate to evaluate changes in temperature between night and day. Weather-data software packages that provide observed temperature statistics in three-hour time increments are available, making this level of analysis possible.
By combining the tower performance curve, process performance curve, economic impact curve and annual weather curves, the economic value of restoring the tower to its original design condition can be predicted.
Next, the technical options for restoring the tower (fill media replacement, water distribution system refurbishment, mechanical component upgrades) must be identified and analyzed against the impact of a complete system replacement.
4. Complete a financial optimization analysis of the proposed solutions.
Traditionally, the selection of an “optimized” cooling tower was one that merely balanced the initial cost vs. operating cost, based on continued operation at its design point. This model, however, neither considers the impact on process operations, nor operations above or below design conditions. An integrated model that calculates and ranks multiple iterations while also considering the entire range of weather and operating conditions is the best way to properly optimize the selection of a replacement tower.
The overall value equation for comparing cooling tower installations should generally include:
- Capital costs for equipment and installation
- Electricity costs for fan and pump operation
- Water treatment costs
- Maintenance costs (especially important for comparing a new tower purchase to a repair/rebuild)
- Operating cost reductions due to lower operating temperatures
The first step in performing this optimization is determining what financial measure will be optimized. This requires engineers and plant personnel who recommend equipment purchases and upgrades to understand the company’s evaluation criteria for ranking and approving capital projects in order to present a properly optimized solution.
One method of evaluating projects is to set a requirement based on simple payback. Simple payback is a very short-term measure of a project’s return on investment, and is calculated by dividing the total capital expense by the annual economic impact. Simple payback is a screening tool used primarily in constrained environments, and is rarely used as the primary metric for ranking and evaluating capital expenditures. More common measures, such as internal rate of return (IRR), net present value of cashflow (NPV) and economic value added (EVA) provide more meaningful information for long-term value.
Experience has shown, however, that optimizing only one measure might not be the best option. It is therefore crucial to take the appropriate financial metric into account when performing a system optimization. Ultimately, the “best” solution will be determined primarily by the financial results desired—a quick payback or maximum long-term value.
Because of the close interaction between cold water temperature and process performance, it is critical that cooling tower upgrades and repairs be planned and evaluated with a thorough understanding of cooling tower design, process operations and financial metrics.
At its core, engineering is an economic exercise with a basis in science; and while the science of cooling tower operations is very simple, the economic analysis requires rigorous discipline to guarantee that capital and maintenance dollars generate the desired returns. Many cooling tower enhancement projects have significant financial benefits that can be revealed with proper economic analysis—and delaying certain repairs and upgrades can cost plants millions in lost productivity and excessive operating costs.

